Plotting
Overview
Teaching: 15 min
Exercises: 15 minQuestions
How can I plot my results?
Objectives
Create a time series plot of statistical data.
Create a scatter plot of statistical data.
Matplotlib is a plotting library. In this section give a brief introduction to the matplotlib.pyplot module, which provides a plotting system similar to that of MATLAB.
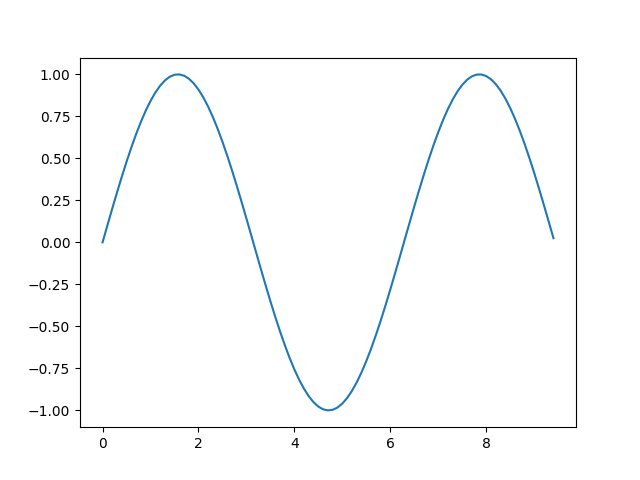
Running this code produces the following plot:
import numpy as np
import matplotlib.pyplot as plt

# Compute the x and y coordinates for points on a sine curve
x = np.arange(0, 3 * np.pi, 0.1)
y = np.sin(x)

# Plot the points using matplotlib
plt.plot(x, y)
plt.show()  # You must call plt.show() to make graphics appear.
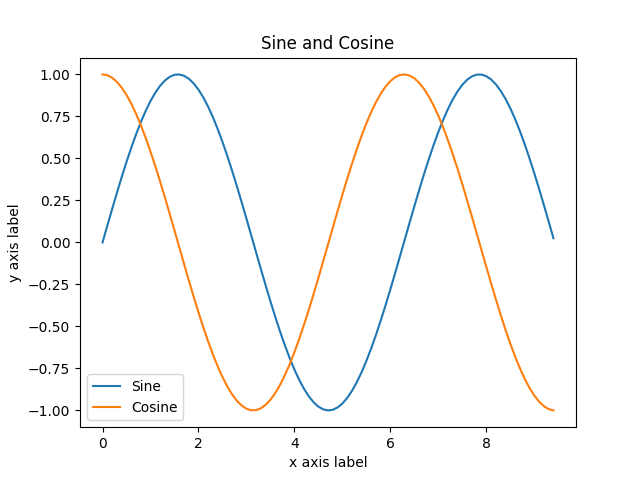
With just a little bit of extra work we can easily plot multiple lines at once, and add a title, legend, and axis labels:
import numpy as np
import matplotlib.pyplot as plt

# Compute the x and y coordinates for points on sine and cosine curves
x = np.arange(0, 3 * np.pi, 0.1)
y_sin = np.sin(x)
y_cos = np.cos(x)

# Plot the points using matplotlib
plt.plot(x, y_sin)
plt.plot(x, y_cos)
plt.xlabel('x axis label')
plt.ylabel('y axis label')
plt.title('Sine and Cosine')
plt.legend(['Sine', 'Cosine'])
plt.show()
To save it use plt.savefig('figname.ext'). You can read much more about the plot function in the documentation.
Subplots
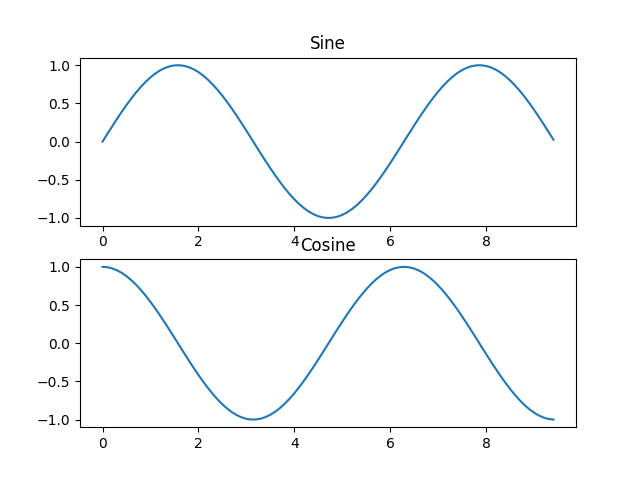
You can plot different things in the same figure using the subplot function. Here is an example:
import numpy as np
import matplotlib.pyplot as plt

# Compute the x and y coordinates for points on sine and cosine curves
x = np.arange(0, 3 * np.pi, 0.1)
y_sin = np.sin(x)
y_cos = np.cos(x)

# Set up a subplot grid that has height 2 and width 1,
# and set the first such subplot as active.
plt.subplot(2, 1, 1)

# Make the first plot
plt.plot(x, y_sin)
plt.title('Sine')

# Set the second subplot as active, and make the second plot.
plt.subplot(2, 1, 2)
plt.plot(x, y_cos)
plt.title('Cosine')

# Show the figure.
plt.show()
You can read much more about the subplot function in the documentation.
Exercises
- Modify plots used in teaching.
Reference:
- http://cs231n.github.io/python-numpy-tutorial/
Key Points
Use matplotlib with arrays or data frames to visualize data.
Decide what kind of plot to create based on what questions you want to answer.