Bootstrap Confidence Interval, Explained with Pictures
Published:
You have one sample and one mean. How sure are you about that mean? A confidence interval (CI) answers this question. The bootstrap is a way to get a CI without assuming that your data follow a normal distribution. All you need is a computer that can shuffle numbers.
1. The idea: resample your own data
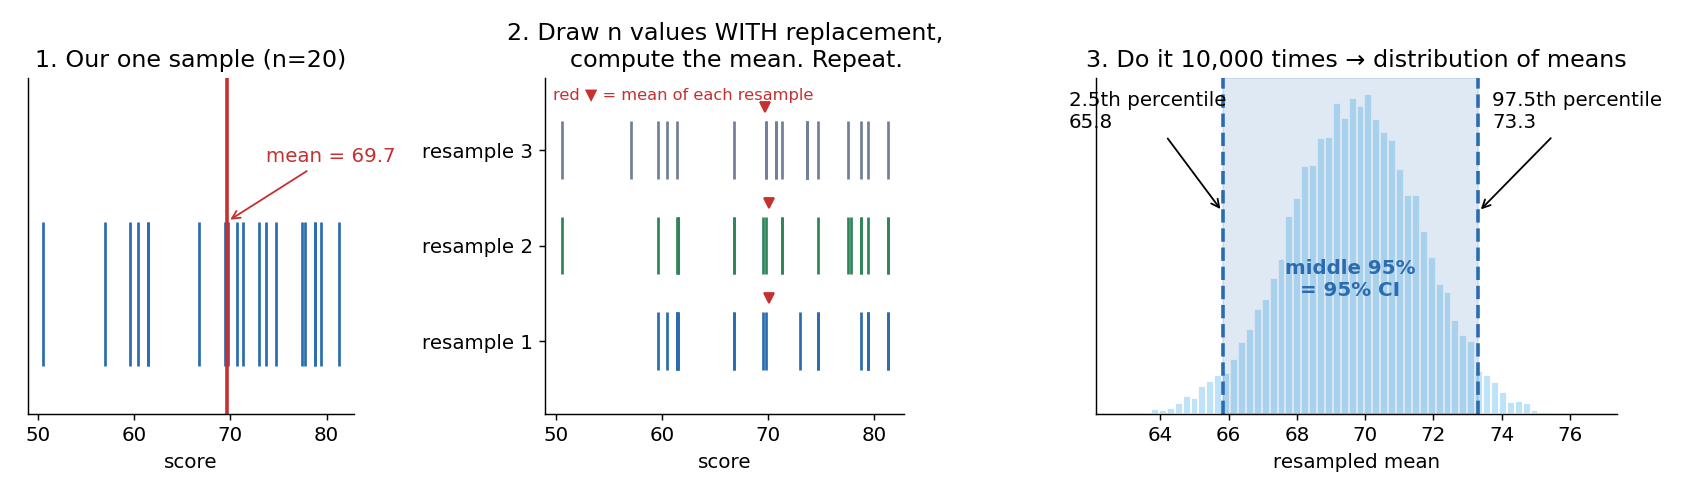
Read the figure from left to right:
- Our one sample. We measured 20 scores. The mean is about 70. That is all the data we have.
- Resample with replacement. Draw 20 values from the sample, one at a time, and put each value back after drawing it. Some values show up twice, some not at all (see the doubled lines). Compute the mean of this new “fake” sample (red triangle). Each resample gives a slightly different mean.
- Repeat 10,000 times. Plot all the resampled means. They form a bell shape around the original mean. Cut off the lowest 2.5% and the highest 2.5%. The middle 95% is the 95% bootstrap CI.
In plain words: “If I could repeat my experiment many times, where would most of the means land?” We can’t repeat the experiment, so we repeat the sampling from our own data instead.
2. Does the interval include zero?
This matters most when you compare two conditions. Take the difference (for example, \(\text{after} - \text{before}\)) and bootstrap the mean difference. Zero means “no difference”, so we check where zero sits relative to the interval.
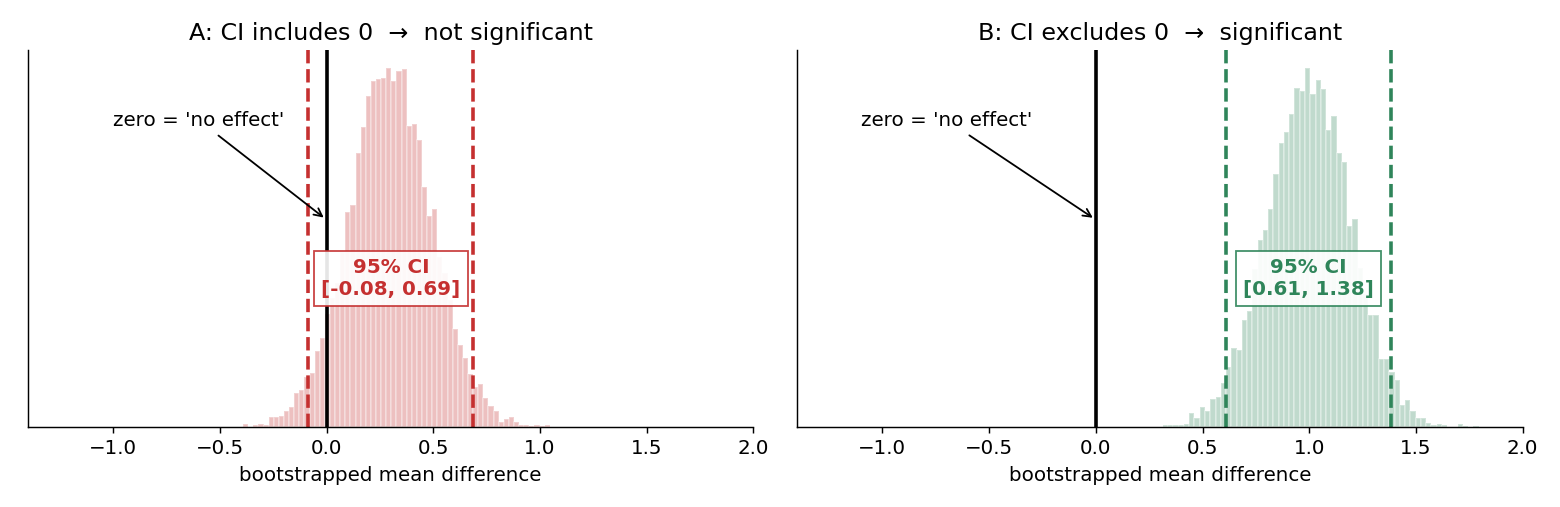
- A (left): the CI includes 0. The black line (zero) is inside the dashed lines. A “no effect” result is still a plausible value, so we cannot say the difference is real. It is not significant at the 5% level.
- B (right): the CI excludes 0. Zero is outside the interval, in the tail where almost none of the resampled means fall. “No effect” is not plausible, so the difference is significant at the 5% level.
Two cautions:
- Excluding zero only means the effect is probably not exactly zero. It does not mean the effect is big. Look at the size of the interval too (B ranges from about 0.6 to 1.4, and whether that matters depends on your problem).
- Including zero does not prove “no difference”. It means your data are not enough to tell. With more data the interval usually gets narrower.
A 95% CI that excludes 0 corresponds to \(p < 0.05\) in a two-sided test. This is the same decision rule as in a classic significance test, but the CI also shows you how large the effect might be.
3. Paired vs. unpaired: why it matters
In an earlier post (in Indonesian) I wrote about the paired t-test with LibreOffice Calc. The key point there was that a paired test works on the difference within each pair, and the null hypothesis is that the mean difference is zero. The bootstrap follows the same logic.
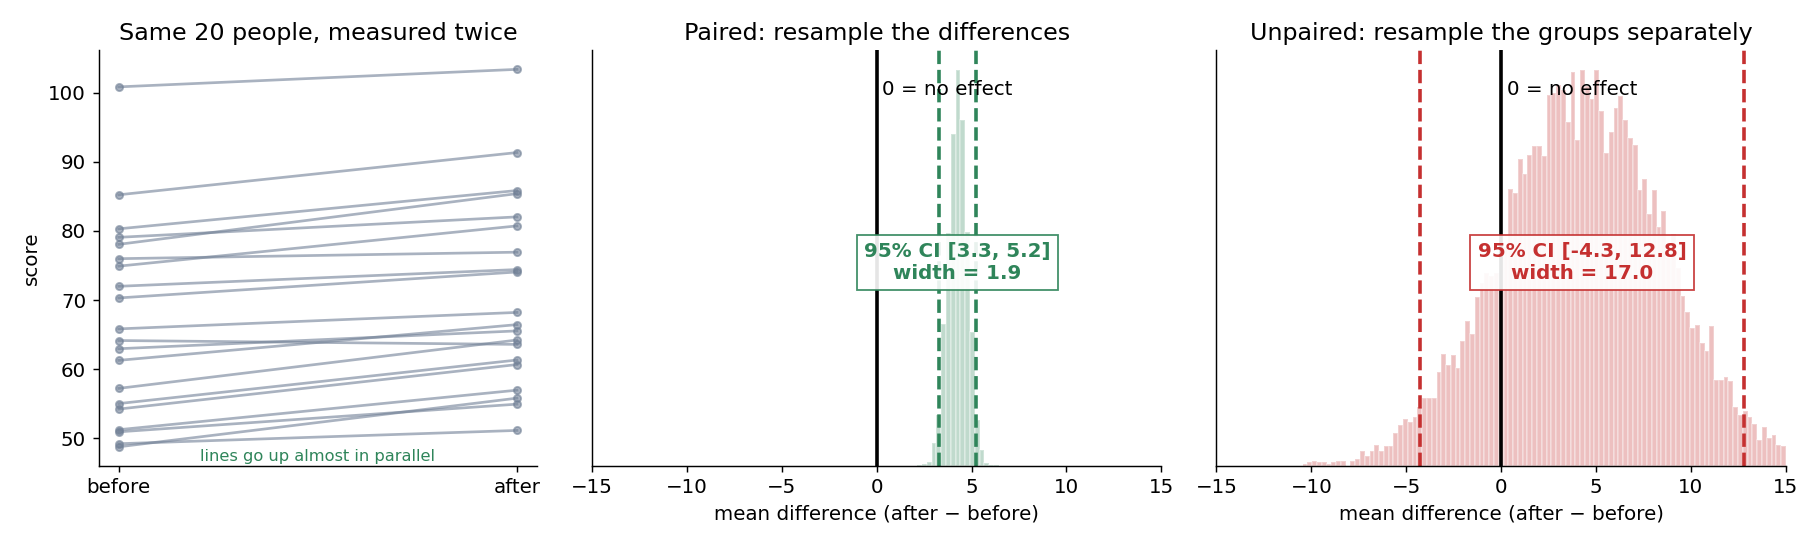
Left: the same 20 people measured before and after. People differ a lot from each other (scores from 50 to 100), but almost everyone gains a little, so the lines are nearly parallel.
Middle, paired bootstrap. Compute \(\text{after} - \text{before}\) for each person first, then resample those 20 differences. The person-to-person variation is cancelled out, because each person is compared with themselves. The CI is narrow and excludes zero.
Right, unpaired bootstrap. Resample the “before” group and the “after” group independently, as if they were different people. Now the large differences between people leak into the result as noise. The CI becomes about nine times wider and includes zero.
Same data, different conclusion. The only difference is whether we respect the pairing.
| Paired | Unpaired | |
|---|---|---|
| Same subjects measured twice? | Yes | No (two different groups) |
| What is resampled? | The differences (pairs stay together) | Each group separately |
| Noise from subject differences | Removed | Stays in |
| Typical use | Before/after, same test set with model A vs. model B | Control group vs. treatment group |
If your data are naturally paired (the same person, the same test sentence, the same dataset split), use the paired version. Treating them as unpaired throws away information and loses statistical power. The reverse mistake is worse: treating independent groups as paired gives wrong answers.
4. Code
A paired bootstrap CI takes only a few lines of Python:
import numpy as np

rng = np.random.default_rng(42)

def bootstrap_ci(x, n_boot=10_000, alpha=0.05):
    x = np.asarray(x)
    idx = rng.integers(0, len(x), size=(n_boot, len(x)))  # resample with replacement
    means = x[idx].mean(axis=1)
    return np.percentile(means, [100 * alpha / 2, 100 * (1 - alpha / 2)])

# paired: bootstrap the per-pair differences
diff = np.asarray(after) - np.asarray(before)
lo, hi = bootstrap_ci(diff)
print(f"95% CI of mean difference: [{lo:.2f}, {hi:.2f}]")
print("Significant" if lo > 0 or hi < 0 else "Includes zero: not significant")
SciPy also has scipy.stats.bootstrap, which can compute this for you (for paired data, pass the differences as one sample). The script that produced all figures in this post is here: bootstrap_ci_figures.py.
Summary
- Bootstrap = resample your data with replacement many times and look at the spread of the statistic.
- The middle 95% of the resampled statistics is the 95% CI.
- CI excludes 0 → the difference is significant (at 5%). CI includes 0 → not enough evidence.
- For paired data, bootstrap the differences. Ignoring the pairing makes the interval much wider.